Ra vs Rz: Surface Roughness Parameters Explained
By Rina Takahashi • 2nd May
Understanding Surface Roughness Parameters
Surface roughness parameters, specifically Ra (Roughness Average) and Rz (Ten-Point Height of Irregularities), are not interchangeable descriptions of "how smooth" a part is. They measure distinctly different characteristics of a surface's micro-topography. Understanding when and why to use each one is fundamental to avoiding scrap, failing audits, and misaligning tolerance stacks with your measurement capability. For a broader overview of methods and pitfalls, read our surface roughness measurement guide. This guide walks through the distinctions, the data behind them, and how to engineer roughness measurement into your workflow (not simply buy a tool and hope).
FAQ: Ra vs Rz in Depth
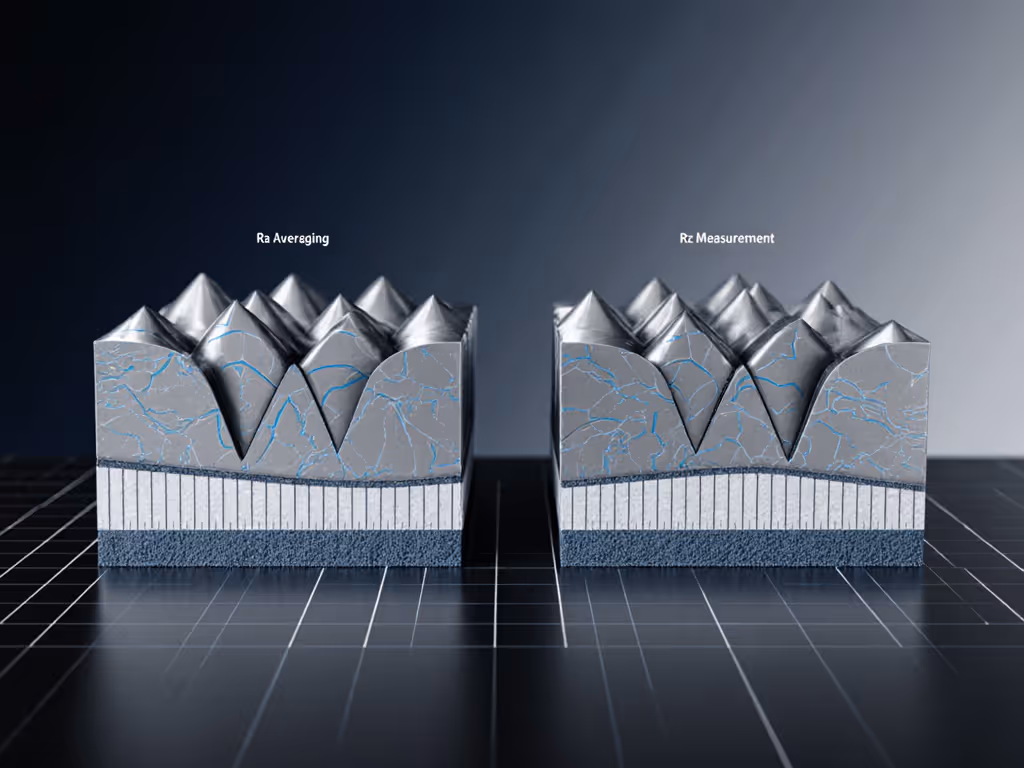
What Do Ra and Rz Actually Measure?
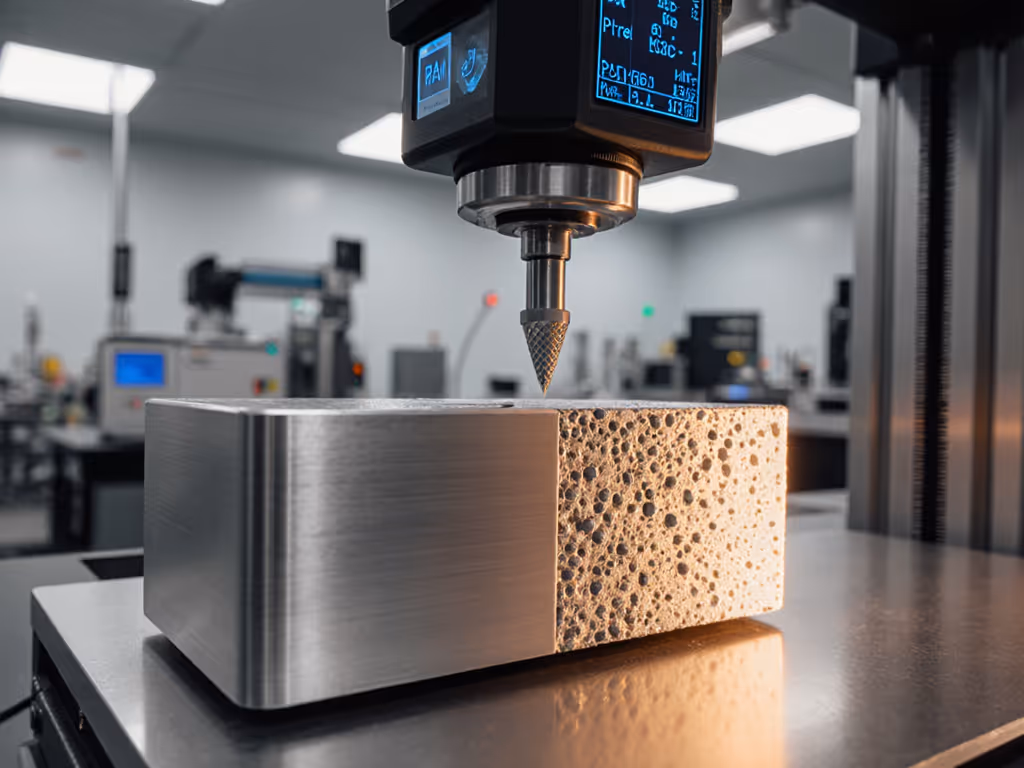
Ra is the arithmetic mean of the absolute deviations of surface peaks and valleys from a centerline, averaged over a defined sampling length. In practical terms: collect all the ups and downs, ignore their direction (treat them as absolute values), and average them. The result is a single, smoothed metric. Assume units of microinches (µin) or micrometers (µm), and conditions specified as per ISO 4287 or ASME B46.1.
Rz, by contrast, focuses on extremes. It is the average vertical distance between the five highest peaks and the five deepest valleys within each sampling section, then averaged across those sections. Where Ra hides outliers in a mean, Rz brings them into sharp focus. The practical implication: Rz tells you whether a surface will seal properly or wear unevenly; Ra tells you whether the overall texture is fine or coarse.
Shop by tolerance stack, environment, and workflow (or accept drift). The same principle applies to roughness measurement: choose the parameter that maps to your functional requirement, or risk tolerance stack misalignment.
When Do I Specify Ra, and When Rz?
Use Ra when overall surface finish quality is the primary concern, such as general aesthetic appearance, baseline wear resistance, or a catch-all general-purpose specification. Ra is also the most commonly cited parameter in legacy drawings and industry standards, simply because it is easier to communicate and has historical precedent. Assume a ±20% measurement uncertainty (one standard deviation) when specifying Ra on a drawing, and state your sampling length explicitly (often 0.8 mm per ISO 4287, or 0.030 in per ASME B46.1).
Use Rz when functional performance depends on extreme irregularities: sealing surfaces (gaskets, O-rings, valve seats), sliding interfaces (bushings, ways), or dynamic contact zones (rolling bearings, cams). Rz also matters in tribological applications where a single deep scratch or sharp peak can initiate wear or cavitation. When Rz is your specification, the uncertainty budget tightens. For step-by-step help building a defensible measurement uncertainty budget, see our guide. Assume ±15% uncertainty, but only if your profilometer is calibrated traceable to a standard and your sampling strategy is consistent.
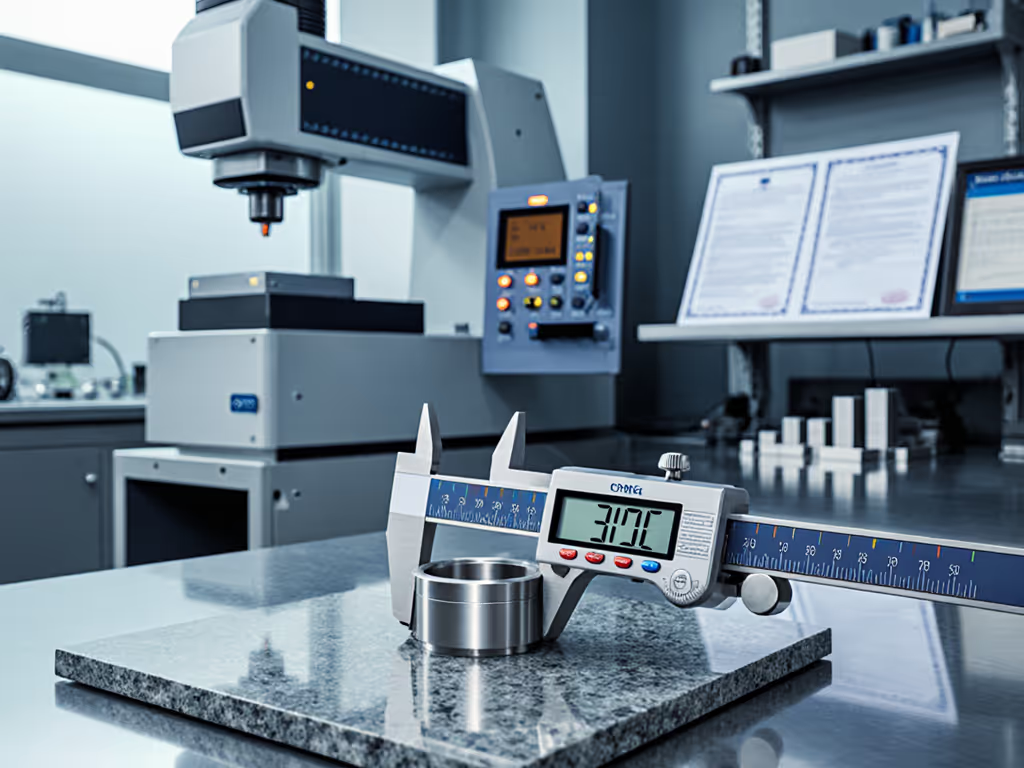
A practical example from the field: during a heat wave, our surface plate's temperature drifted 3°C over an hour, causing a linear expansion of approximately 0.0003 inches per inch. That thermal shift was enough to push the surface plate outside its tolerance band and cause our Ra and Rz measurements on the same part to shift by 10-15% depending on which region we sampled. The lesson: environment engineering is part of measurement capability engineering. We re-baselined our gauge blocks once the lab returned to stability, logged hourly temperature and humidity, and established environmental controls. To set proper intervals and maintain traceability, see our gauge block calibration guide. Only then did our CMM results correlate reliably with micrometers and profilometers taken on the shop floor.
Can You Convert Between Ra and Rz?
No, not reliably. Industry folklore suggests a simple ratio: "Rz ≈ 4 × Ra." The data shows this is a myth. Real conversion ratios range from 2:1 to over 20:1, depending on surface texture, material, and cutting conditions. A highly directional finish (turning, grinding) may track closer to 4:1; a random-pattern finish (blasting, honing) may diverge widely. Attempting to convert between them introduces error bars that swallow your tolerance stack.
Correct practice: If your drawing specifies Ra, measure Ra. If your functional requirement demands control of peak-to-valley height, specify Rz and measure Rz. Never infer one from the other. The data does not support it, and auditors will call you out.
How Does Environment Influence Roughness Measurement?
Environmental drift is often overlooked in roughness specifications, yet it is one of the largest sources of unquantified error. Assumptions to state explicitly:
- Temperature: Profilometer stylus and part thermal expansion differ. A 5°C swing can shift measured roughness by 5–8%, especially on long-span samples. Calibrate your profilometer at measurement temperature, and log ambient conditions.
- Humidity: Corrosion, oxide films, and adsorbed moisture alter surface reflectivity and stylus contact. Specification should assume 45-55% RH unless explicitly controlled.
- Vibration: Mechanical vibration from nearby machinery couples into the measurement rig. Isolate profilometers on damped stands, and re-baseline after heavy turning or grinding work nearby.
- Coolant and contamination: Oil, salt spray, and dust alter the stylus-surface interaction. Clean parts to a defined state (solvent, lint-free cloth, air dry, time at equilibrium) before measurement.
Documenting these conditions is not pedantic. It is the foundation of reproducibility. Any measurement report lacking temperature, humidity, and cleaning state is anecdotal, not data. Learn how to document the full chain with our primer on measurement traceability.
How Do I Choose the Right Roughness Parameter for My Tolerance Stack?
Begin with your functional requirement, not your gut. Ask: "What could go wrong if this surface is too rough?" Answers drive parameter selection.
- Sealing or leak prevention? Use Rz. Specify a maximum peak height (Rp) or valley depth (Rv) as well. Uncertainty budget: ±0.15 × target Rz.
- Sliding wear or friction? Use Ra as a baseline, but cross-check with Rz to catch scratches. Uncertainty budget: ±0.20 × target Ra.
- Optical surfaces or aesthetic finish? Ra alone is often sufficient. Uncertainty budget: ±0.25 × target Ra.
- Bearing or dynamic load zones? Use both Ra and Rz; set separate limits. Uncertainty budget: ±0.15 × target for each.
Next, map your roughness target to your process capability. CNC turning typically holds Ra 32-64 µin (0.8-1.6 µm); grinding holds Ra 8-16 µin (0.2-0.4 µm); polishing and lapping, Ra 2-8 µin (0.05-0.2 µm). If your drawing specifies Ra 4 µin but your shop's turning capability is Ra 32 µin, you have a process-to-tolerance mismatch. For a framework to align tool class with tolerance, use our measuring tool selection guide. Tighten tolerances, upgrade tooling, or escalate to engineering. Do not measure and hope.
Finally, allocate uncertainty to your measurement tool. A 10:1 test accuracy ratio is the baseline for critical dimensions; apply the same logic to roughness. If your tolerance is ±Ra 8 µin, your profilometer should repeatably resolve ±0.8 µin (one-sigma). Most shop-floor instruments do not, which is why lab-grade profilometers and surface plate environments are non-negotiable for traced calibration.
Moving Forward: Integrate Roughness into Your Workflow
Roughness parameters are not spec-sheet footnotes: they are functional specifications, measurement points, and cost drivers. Treat them as part of your tolerance stack. Document assumptions (sampling length, temperature, humidity, stylus force, cleaning state). Correlate lab measurements with shop floor data using the same instrument, under controlled conditions, and traceable to a standard. Train your technicians on stylus placement, scan direction, and surface cleanliness. And when environmental drift occurs (and it will) log the data, re-baseline, and adjust your capability claims.
Further Exploration
Consider these next steps to deepen your roughness measurement capability:
- Review your current Ra and Rz specifications against your process data. Do they align, or is there hidden scrap and rework?
- Conduct a measurement system analysis (MSA) on your profilometer or surface roughness gauge. Collect repeatability, reproducibility, and linearity data across your tolerance band.
- Document environmental controls in your calibration procedure. Temperature, humidity, vibration, and cleaning are not optional. They are part of your uncertainty budget.
- Cross-correlate lab and shop measurements on the same batch of parts using different instruments. Are results consistent? If not, investigate fixturing, stylus force, sampling strategy, and calibration traceability.
- Engage your supplier or metrology service to validate your roughness specification against functional requirements. Ask for uncertainty budgets and sampling data, not just a pass/fail.
Measurement capability is engineered across tool, process, and environment, not purchased off a shelf. Start with function, layer in tolerance, and build environmental control on top. Your audit confidence, and your first-pass yield, will follow.
Related Articles